For years, industry advocates have claimed that structures built with ICFs perform far better than the tested R-Values (usually between R-22 and R-25) would indicate.
For years, industry advocates have claimed that structures built with ICFs perform far better than the tested R-Values (usually between R-22 and R-25) would indicate.
They attribute this to the unbroken insulation, reduced air infiltration, and thermal mass of the wall.
Mass walls have proven to be effective at reducing wide daily temperature swings. Field data and lab tests back this up. Another claim, though, has proven to be more controversial: Some individuals have claimed that the ICF concrete core maintains a stable temperature by tapping into the steady 50 degree soil surrounding the footings.
The theory is based on the idea that concrete conducts temperatures fairly well. Poured concrete has an R-Value of 0.08 per inch, so even eight feet of concrete has less insulating value than 2 inches of EPS foam, which typically tests at R-4 per inch. (96 x 0.08=7.68 < 8=4 x 2).

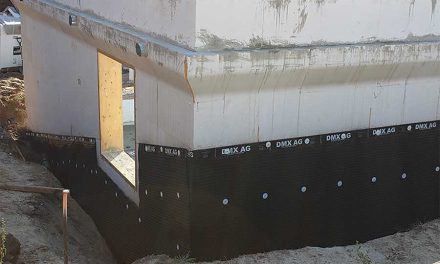
Temperature sensor locations in the Green Dream Home are marked in red. Note the additional foam added to the ICF exterior in the construction photo.
Based on the large volume of soil directly in contact with the footing, it seems logical that some “ground coupling effect” could contribute to ICF’s energy efficiency. Until now, though, there has been no hard data to back up these claims.
If this is a true phenomena, then the concrete core of the wall should match the soil temperature near the footing, becoming closer to the ambient air temperature as one rises higher in the structure (further from the footing) and the air temperatures on both sides of the wall have a greater influence on the concrete. Thicker foam and unconditioned interior spaces would theoretically yield more accurate results.
Cameron Ware, BSME, is a Texas-based NUDURA distributor who regularly contributes to this magazine. He uses the following example to demonstrate this phenomena, and notes that virtually anyone can conduct the experiment themselves for less than $20. His test method involves taking an eight-foot length of #5 (or thicker) rebar and driving it into the ground deep enough to reach stable soil temperatures (about two feet). The rod represents the concrete core. The remainder of the rod is then coated with a continuous layer of foam insulation—at least two inches thick on all sides and the top—to mimic the EPS foam on ICF walls. (This is easily accomplished with a can or two of expanding urethane spray foam.) All that’s left to do is to monitor the rod’s temperature at various heights above the ground, which can be done with an infrared thermometer. This experiment works best when the difference between the ground temperature and the ambient air temperature is greatest (mid-summer or mid-winter).
I opted to forego this experiment, choosing instead to analyze field data gathered from thermocouples installed in ICF structures in the U.S. and Canada. The results may surprise you.
Case Study 1: Green Dream Home
I began by examining temperature wicking in cold-weather climates, requesting data logs from the Green Dream Home in Kamloops, British Columbia, Canada. This 3,100 sq. ft. residence is a Net Zero Energy Home built by Thompson River University (TRU) trade students. Completed in May 2010, the home was one of the 2011 ICF Builder Award winners.
 One of the home’s sponsors, Canada Mortgage and Housing Corporation (CMHC), monitored energy usage for the first full twelve months of ordinary use, using sophisticated utility meters and temperature sensors built into various cross-sections of the walls. This data was collected and analyzed by TRU building science students.
The structure’s walls are constructed with LOGIX’s XRV panels, which have 4” of foam on the outside. An additional 4” of foam was then added to the outside face of the wall, so it totals 8” of exterior foam. The walls have 8” concrete cores, and 2.75 inches of EPS foam on the interior. The wood frame roof was sealed to R-60 with expanding spray-on foam ensured a well sealed envelope (ACH of 0.68 @ 50 Pa).
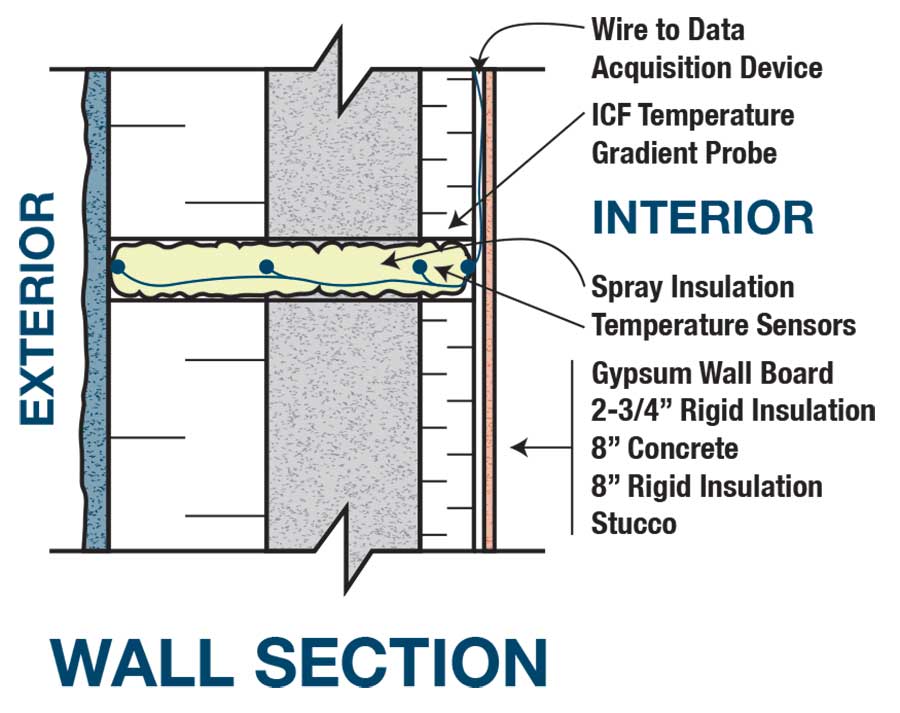
Temperature sensors were installed at four locations in the wall cross section. The diagram above indicates how they were placed in a 1” core at the Green Dream Home. At the Southface Energy Office, the sensors were cast into the concrete.
This home used a setup of four thermocouples per cross section—one on each exposed face of the foam, and two more at the junction between the concrete and the foam. These were installed by drilling a 1” diameter hole through the wall, affixing the probes with foil tape, then filling the void with expanding spray foam.
The five data collection sites were scattered on the various exterior walls. To analyze for evidence of thermal wicking, I isolated the data from two locations in the same vertical
plane. Probe B is located on the south wall a few feet above the main floor. Probe C is located directly below Probe B in the walkout basement. Probe E collected outdoor ambient air temperature from beneath a nearby shaded deck.
Evidence from this home of thermal wicking was weak at best, despite the additional insulation on the outside of this structure. This may be attributed to a number of factors, including the proximity of windows, the fact that the upper wall received maximum solar gain while the lower wall was shaded, or the method of installing the probes.
Case Study 2: Southface Eco-Office
The Southface Eco-Office, in Atlanta, Ga., is a LEED Platinum-level office building built with American Polysteel ICFs. The three-story, 10,000 sq. ft structure is headquarters for the Southface Energy Institute, a non-profit organization that promotes sustainable homes, workplaces and communities. The walls are embedded with 36 thermocouples, which have recorded information since the building was completed in early 2009.

The 3-story Southface Energy Office in Atlanta, Ga., was built with PolySteel ICFs and wired with 36 thermocouples. Data collected from these sensors has provided the first hard evidence that thermal wicking is an actual, measurable phenomena.
Like the Kamloops home, the sensors are installed in sets of four: one each on the interior and exterior face of the foam, and two more on each side of the concrete core. However, these probes were placed before the concrete was poured; they are encapsulated in the matrix. Sidewall thickness was 2.5” per side. Each of the three floors have one set of four thermocouples on the north, south, and east sides of the building, making nine data locations total. This gave me three sets of stacked data loggers measuring temperatures at 8, 18, and 25 feet above the footing.
I examined a full year of data (March 2011 to March 2012) which had hourly temperature readings for all 36 data loggers. Dry-bulb and wet-bulb exterior temperature readings were also recorded every day.
The results: First, the core was remarkably stable. The difference between the interior and exterior faces of the concrete core was almost negligible, never more than 0.4 degrees Fahrenheit on the north face of the building, and no more than two degrees Fahrenheit on the south and east faces in the direct summer sun. Over the course of the year, the temperature of the core varied from 60 degrees on winter nights to 81 degrees on summer afternoons. And the maximum difference between north and south faces was never more than 4 degrees.
As for temperature wicking, data from the Southface office offers intriguing evidence that this phenomena is real. Every hot day in the summer showed the lower core was consistently cooler on all sides than the concrete above it. Let’s pull a hot summer day at random (July 18, 2011 at 3 p.m.). The outdoor ambient air temperature (OAT) is 89 degrees. The north face exterior concrete sensors report temperatures (from the ground up) of 76.3, 79.0, and 81.4 degrees. Those on the east face record data of 79.8, 82.3, and 83.0.
Sensors on the south wall report a miniscule difference, with the lower sensor being only 0.3 degrees cooler than the uppermost one; which seems to indicate that thermal wicking, though real, isn’t as influential as other factors.
Every day that the daily high temperature exceeded the estimated stable soil temperature, the upper concrete sensors were warmer than those below them.
However, if temperature wicking is a true phenomena, the opposite effect should be evident in winter. Lower floors should be warmer. Let’s pull data for Monday, Dec. 26, 2011. This was a holiday in the U.S. so the building had been unoccupied (but still conditioned) for 48 hours. At 5:00 a.m., the OAT was 36 degrees. The North face exterior concrete sensors report temperatures (from the ground up) of 62.3, 58.8, and 58.5 degrees. Data loggers on the south and east face showed the same trend, although the difference was a more modest 2 degree difference top to bottom.
This data appears to back up the hypothesis. And once again, the difference in core temperatures is nearly 5 degrees on the side of the building that isn’t exposed to direct sunlight.
Conclusions
While data from the Kamloops home was not conclusive, the Southface office provides the first compelling evidence that ground coupling/thermal wicking is a real, measurable phenomena that contributes significantly to the energy efficiency of ICFs.
While the small sample size and lack of peer review in this article mean the conclusions above cannot be considered definitive, they do seem to indicate that thermal wicking is not a myth.
There are at least a half dozen other ICF structures across North America that have data to contribute to this debate, and would go far in providing conclusive evidence.
In New York, an ICF home has thermometers mounted in the concrete core every two vertical feet on a twenty-foot-tall section of wall, installed precisely to measure thermal wicking.
Casa Bella Verde, a 50,000+ sq. ft. mansion under construction in Northern California has similar equipment installed, and has collected data for four months already.
In Iowa, a 12’ x 18’ pumphouse has been collecting concrete temperature data for about the same length of time. This data, when it becomes available, might be especially useful, as the interior space is not conditioned, and the footings reach 4’6” below grade.
As data from these projects and others is analyzed and published, the industry will probably be able to make a much stronger case.
In the meantime, based on persuasive data from the Southface Energy Office, the preliminary conclusion is that ground coupling/thermal wicking plays a significant role in the efficiency of ICF walls, keeping temperatures as much as five degrees (F) closer to room temperature than other previously studied factors can account for.